Lev Goncharov
Infrastructure simplifying engineer
About monitoring

Date: 2019-01-24
Monitoring is the most important part of your infrastructure. Monitoring is system engineers basics. However, everyone has his own way to understand it. My way consist of denial. anger & acceptance.
- Denial. You should not monitor anything, because, your users flag you if something strange will occur.
- Anger. You have to monitor everything. You are allowed to notify CTO/CEO if CPU load average metric will be more than 95% during 30 seconds.
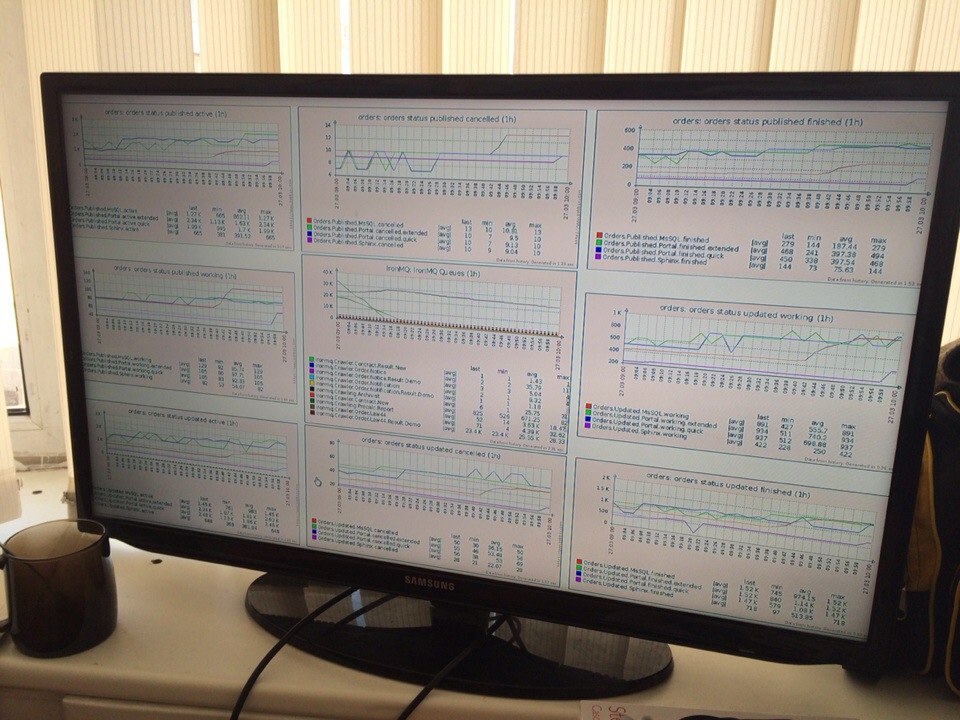
- Acceptance. Business guys don’t care about RAM/CPU/IOPS. Their interest to TTM(time to market) & business metrics.
Denial
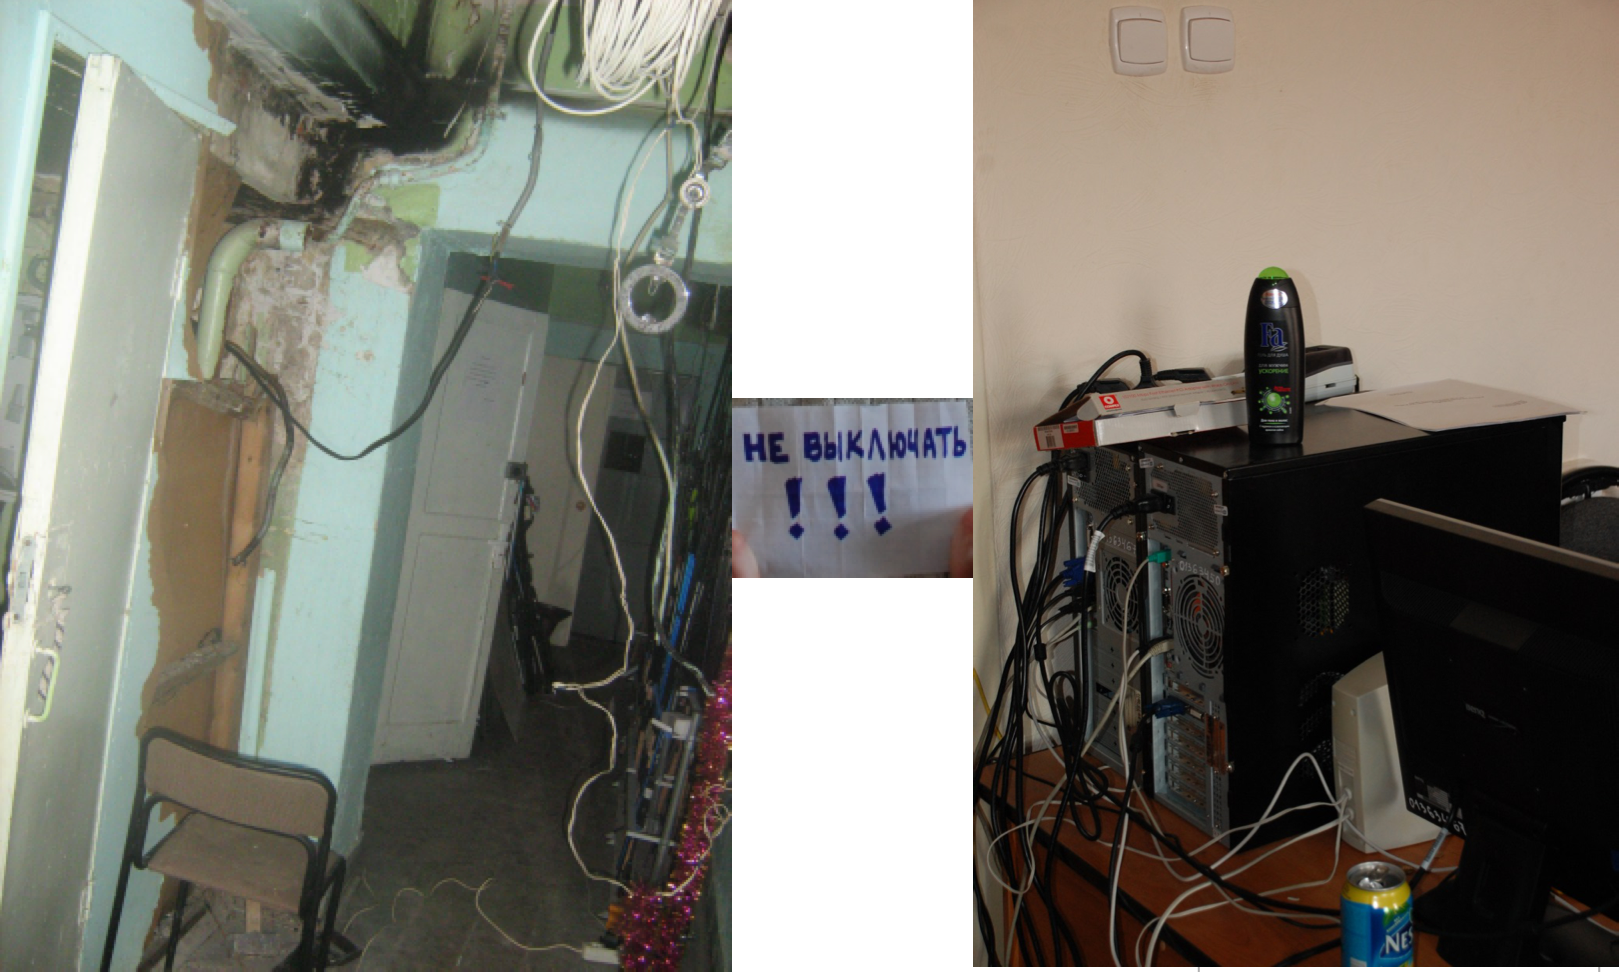
 It’s hard to believe, but there is a server room at the photo.
It was 2007. I was studying at CSU (Chelyabinsk State University) at the information security department as a sophomore. I decided to apply for CSU as an assistant at information security lab. It was a temporary part-time job. After that at 2009, I got one more part-time permanent job at a trading production organization as a system administrator. That time, I didn’t use to know about monitoring, I was wet behind the ears and thought that it was possible to be a hero an solve any faced problem. Hopefully, it was a short period of my life, I felt that it was wrong.
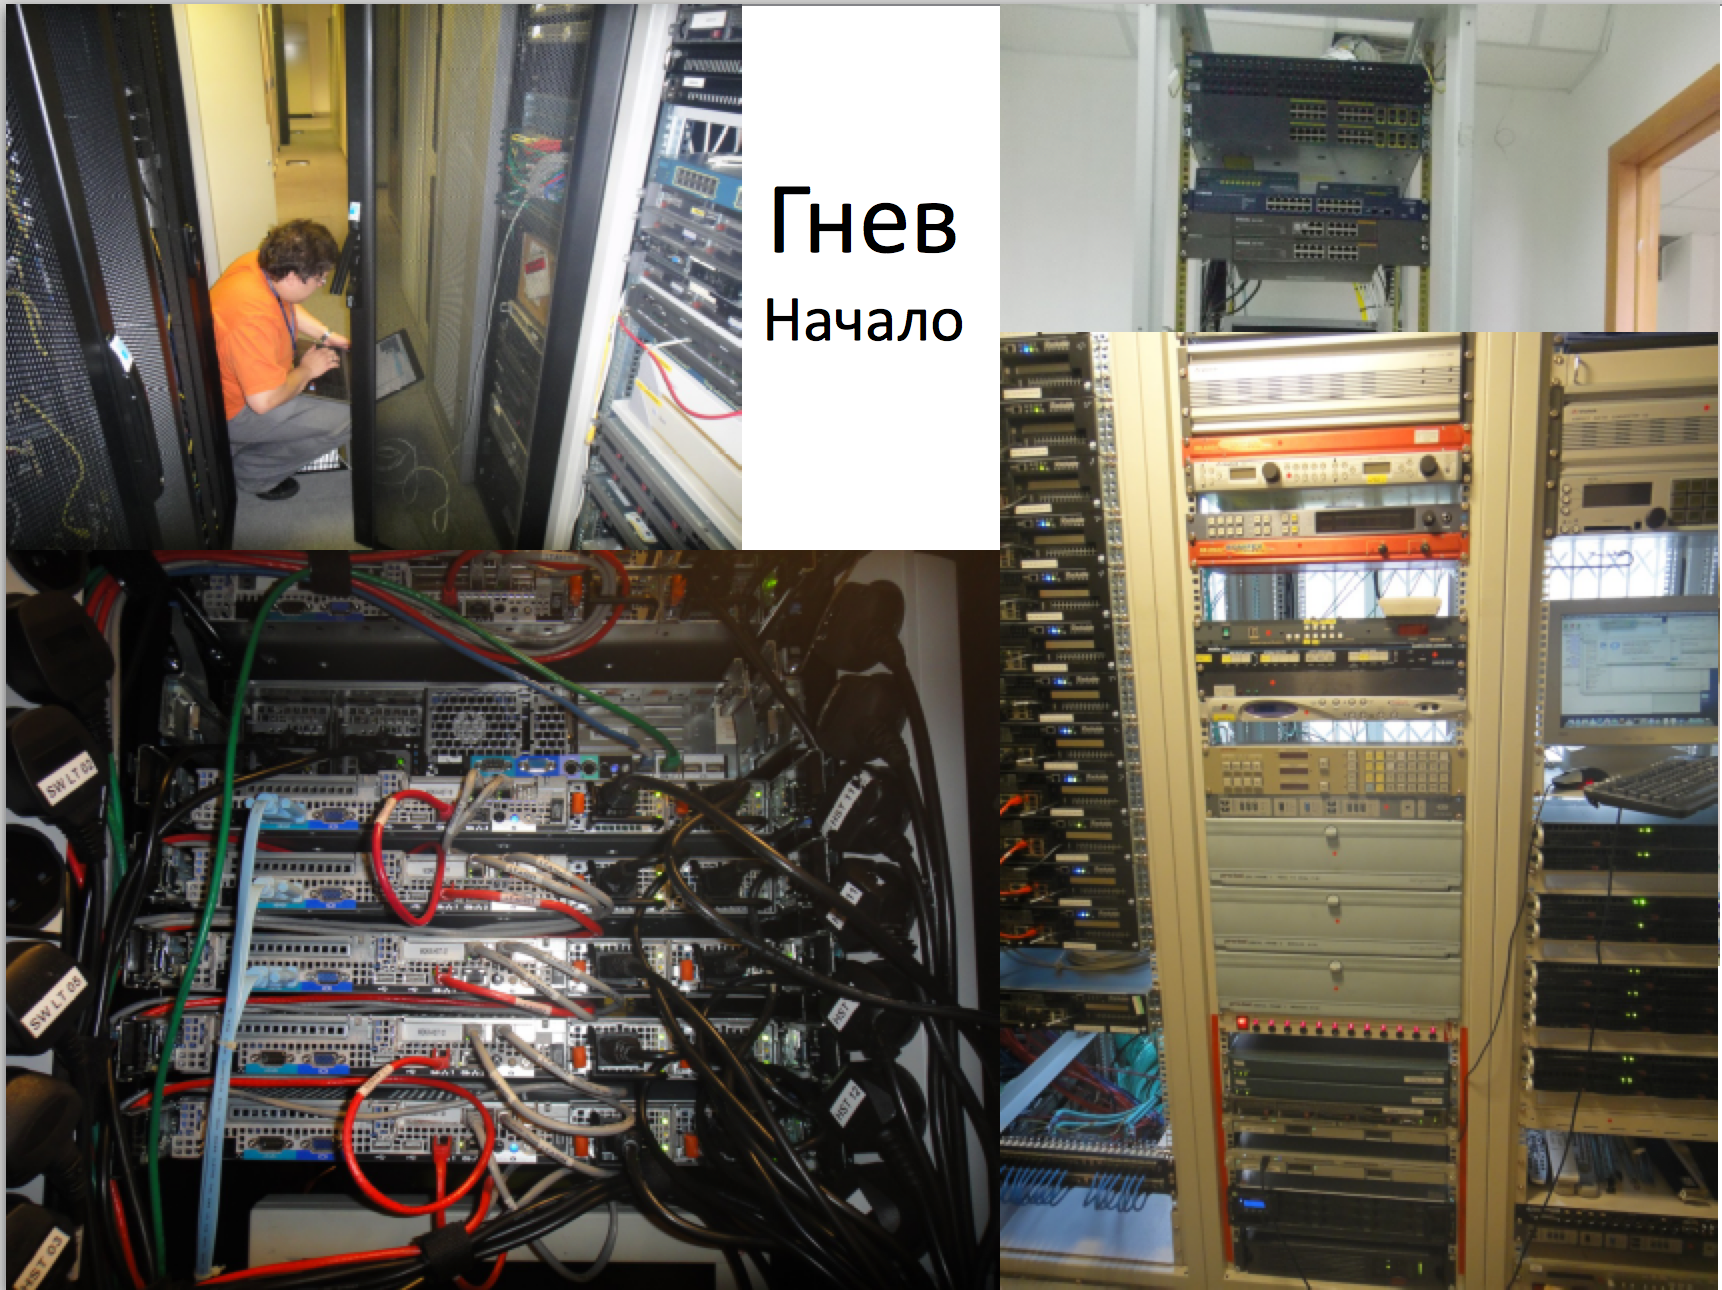
Anger

2010 was one of the most exhausting years. I worked for 2 employers; conducted courses; was preparing master thesis; moreover, I was prefect. Under experience pressure, my vision about monitoring was changing. That process clashed with my resignation. Before graduating exam, I decided to resign and looked for a new job. The vast majority of interviewers were confused because I was a student. However, one of them had agreed to hire me, I had a full-time permanent job for an international multinational company. I graduated; I was improving my skills & experience, I worked for outstaffing companies. The vast majority of our projects were amazing & interesting startups. I extremely levelled up my qualification, because there were no other ways in case of 400 servers for the single person. I had worked as a DevOps before it was mainstream. I burned out at work & decided to change work.
That time, I thought, that we had to monitor everything. It was really important. Everyone should receive monitoring notifications. Also, monitoring toolset was changing & improving. One of the first implementations was bash/PowerShell scripts(free space, count of available updates, backups status, etc) & external services Red Alert, Lazy farmer (in-house tool for site checking). It was good enough in 2010-2011, however, we faced a lot of different issues:
- Email hell.
- Unpredictable delays.
- Unknown resources utilization.
We had decided to do our life a bit easier and choose Zabbix. We monitored everything:
- Count of users connected to wifi.
- Count of printed pages.
- Count alived VPN tunnels.
- Servers temperature.
- Network load.
- etc…
Also, I’d like to share some of the faced issues:
- There were cross DC distributed infrastructures and a lot of metrics. We faced that sometimes metrics were absent. We fixed it via Zabbix proxy.
- If VPN tunnel fails, we will receive a ton of messages. We configured infrastructure dependencies.
- We automated recurrent tasks. i.e. in case of low free space, we tried to clean it automatically.
- We understood that it was a bad idea to notify somebody if the CPU load average metric will be more than 95% during 30 seconds, as a result, we added something like threshold period.
- We checked business-critical scenarios (i.e. web login, search, etc).
- We added Zabbix to skype integrations, because of chat-ops.
- Quis custodiet ipsos custodes?.
- etc…
Acceptance

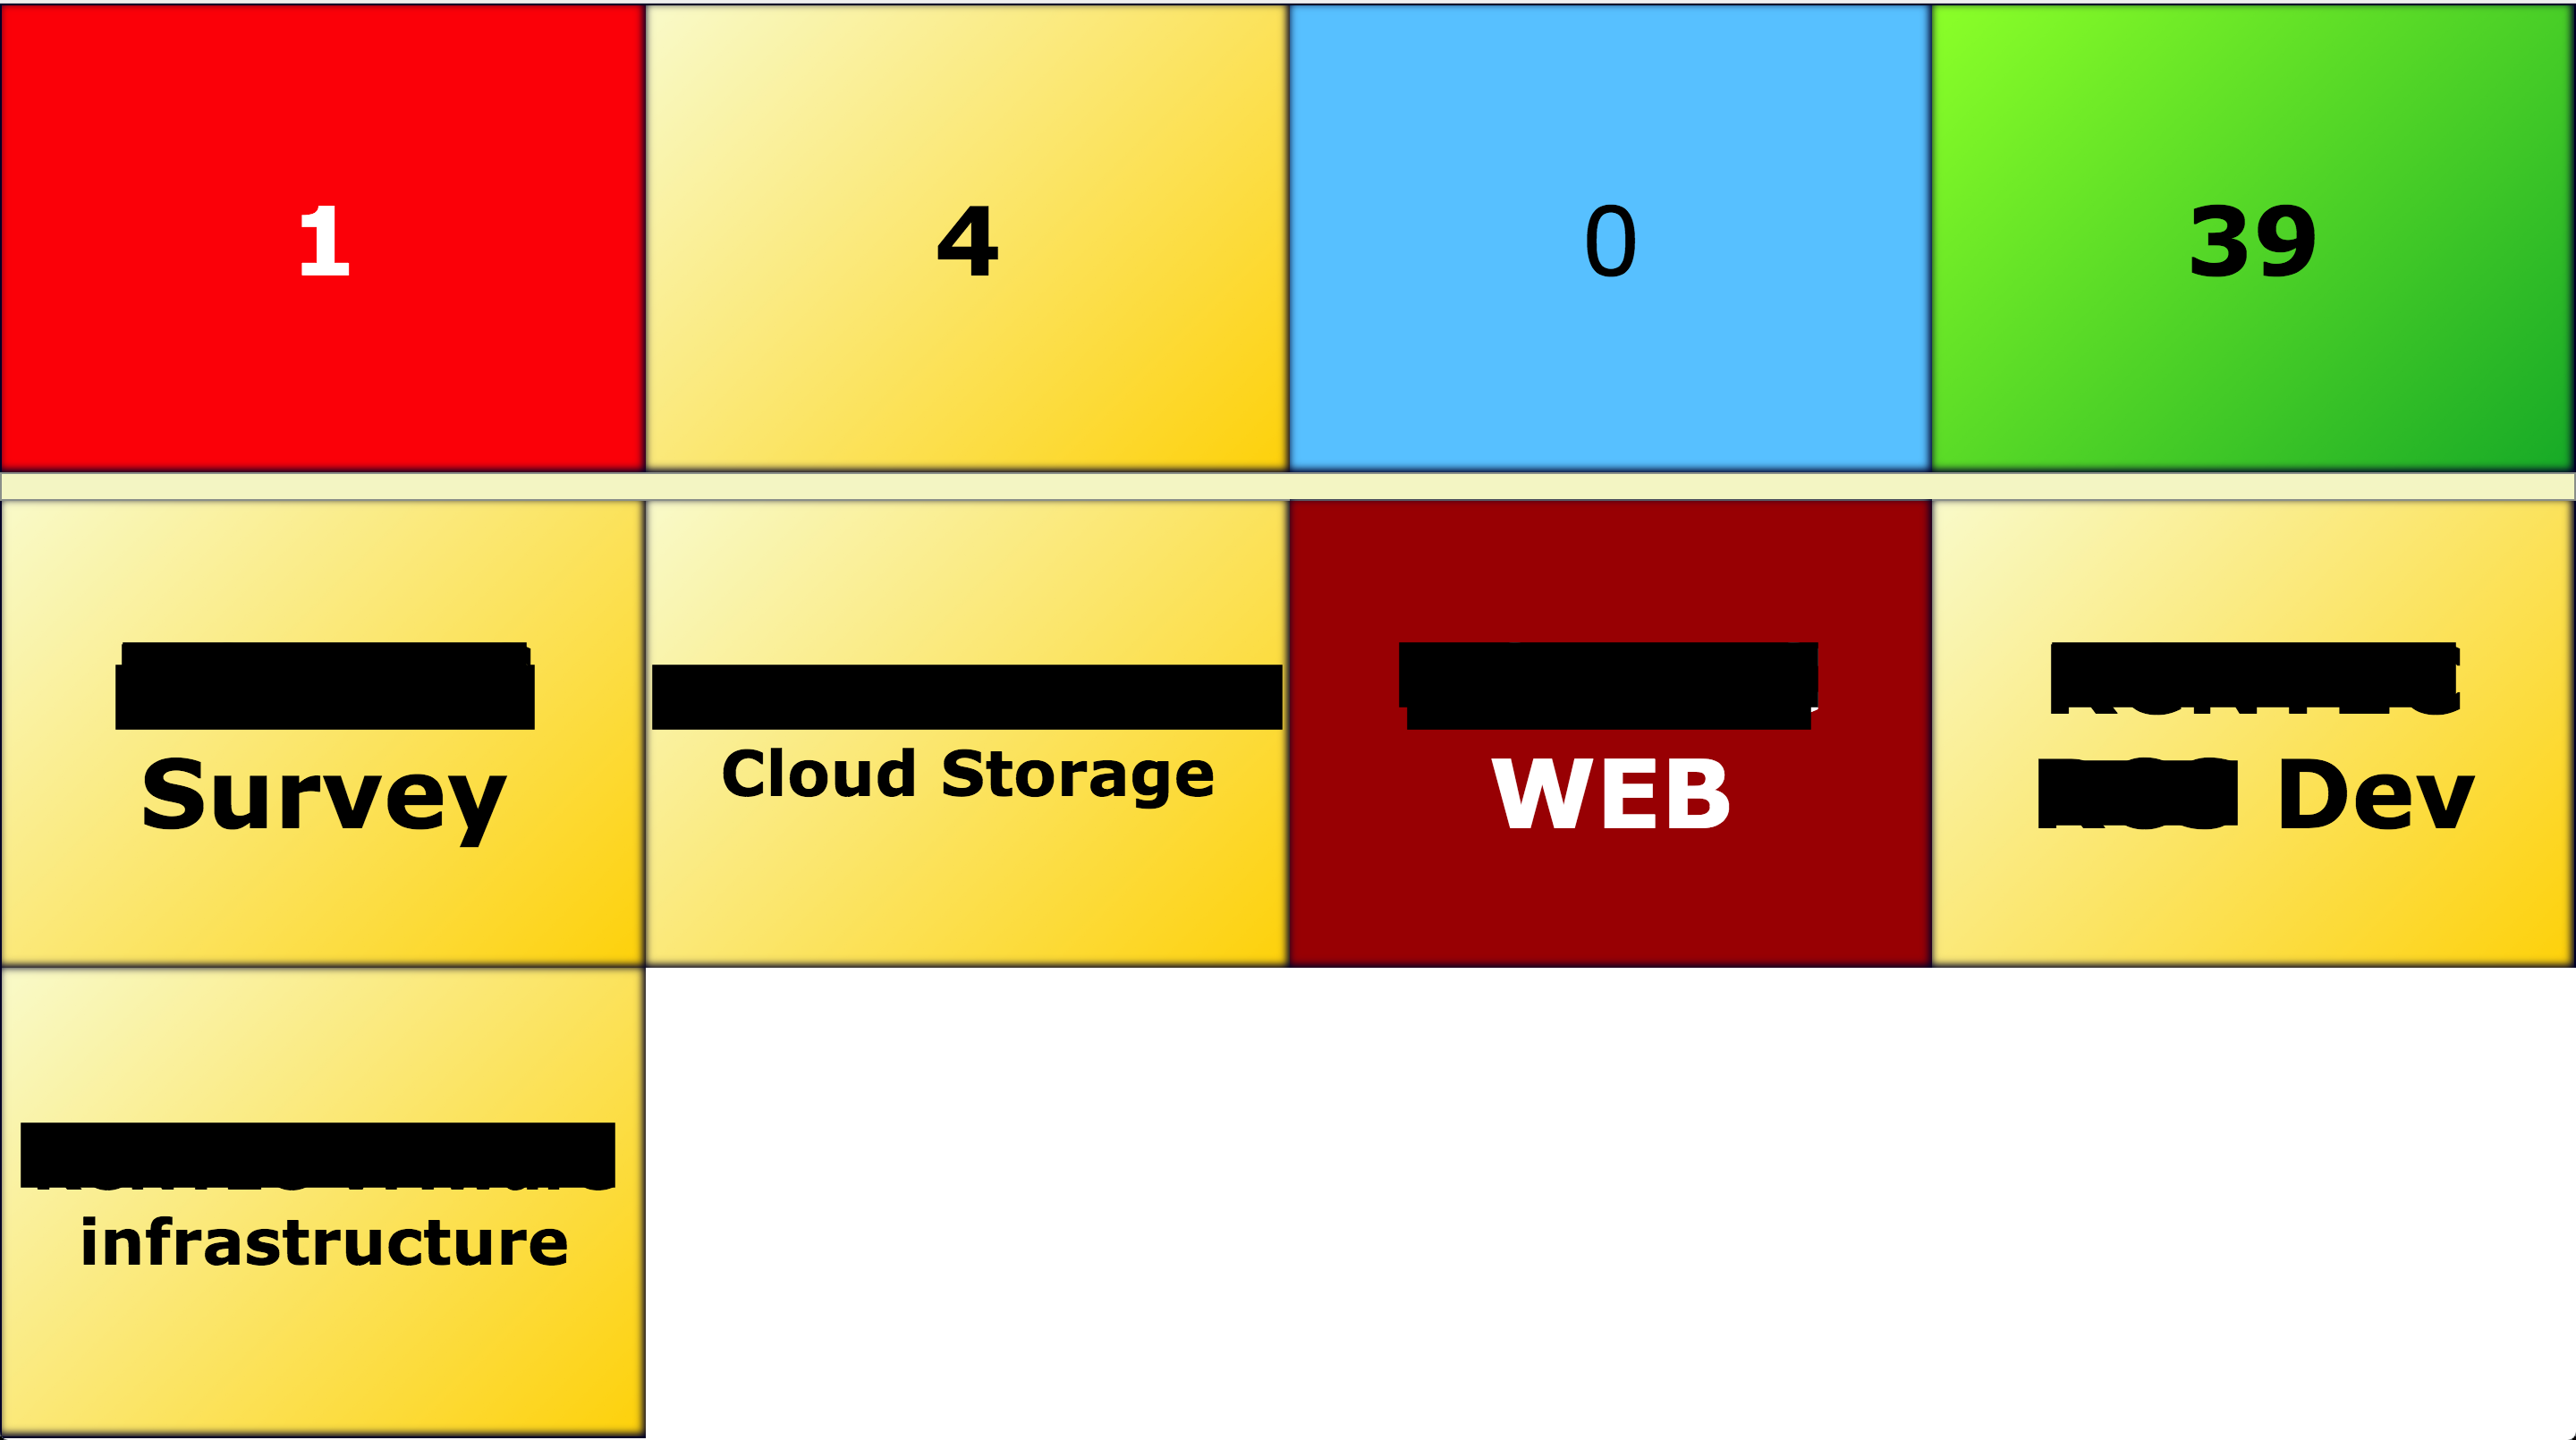
A bit later, I understood that on one hand, business guys don’t care about RAM/CPU/IOPS. Their interest to TTM(time to market) & business metrics, but on the other hand, IT gut should be able to trace any kind of issue.
Zabbix had been good enough, but the world was changing. There were a lot of modern approaches to monitoring.
- It’s possible to split monolith monitoring application to different levels: collect, store, present.
- Business & IT must operate exactly the same data, but they should look at data different points of view.
- There is no silver bullet exists, it means that you should customize your solutions.